- Citation of data and service
-
Always remember to cite data when used!
Citation information for individual datasets is often provided in the metadata. However, not all datasets have this information embedded in the discovery metadata. On a general basis a citation of a dataset include the same components as any other citation:
- author,
- title,
- year of publication,
- publisher (for data this is often the archive where it is housed),
- edition or version,
- access information (a URL or persistent identifier, e.g. DOI if provided)
The information required to properly cite a dataset is normally provided in the discovery metadata the datasets.
If you use data retrieved through this portal, please acknowledge the SAON Data Portal.
- Brief user guide
-
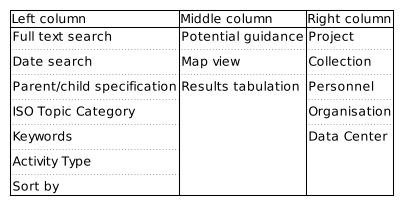
Outline of the data portal search interface. The Data Access Portal has information in 3 columns. An outline of the content in these columns is provided above. When first entering the search interface, all potential datasets are listed. Datasets are indicated in the map and results tabulation elements which are located in the middle column. The order of results can be modified using the "Sort by" option in the left column. On top of this column is normally relevant guidance information to user presented as collapsible elements.
If the user want to refine the search, this can be done by constraining the bounding box search. This is done in the map - the listing of datasets is automatically updated. Date constraints can be added in the left column. For these to take effect, the user has to push the button marked search. In the left column it is also possible to specific text elements to search for in the datasets. Again pushing the button marked "Search" is necessary for these to take action. Complex search patterns can be constructed using logical operators through the drop down menu above the text field. Text strings that are not quoted are treated as separate words and will match any of the words (i.e. assuming the OR operator). Phrases may be prefixed with '-' to indicate no occurence of the phrase in the results.
Other elements indicated in the left and right columns are facet searches, i.e. these are keywords that are found in the datasets and all datasets that contain these specific keywords in the appropriate metadata elements are listed together. Further refinement can be done using full text, date or bounding box constraints. Individuals, organisations and data centres involved in generating or curating the datasets are listed in the facets in the right column.
Visualize timeseries
Show more...
Abstract:
This dataset includes Geophysical Institute (GFI), University of Bergen mooring MD_197105_B data. The mooring consists of 6 inst. (instrument type:instrument number(instrument depth)):RCM4:188(150m) RCM4:187(235m) RCM4:53(315m) RCM4:71(360m) RCM4:65(405m) RCM4:41(405m) . Metadata and raw/processed time series are presented as NetCDF, text and pdf(plots with statistics, calibration sheets, mooring drawing) files.Access: Open-
Show more...
Abstract:
The Barnes Ice Cap data set contains survey measurements of a network of 43 stakes along a 10 km flow line on the northeast flank of the south dome of the Barnes Ice Cap. The measurements are of mass balance, surface velocity, and surface elevation. They were taken over a period of time from 1970 to 1984.
The data set came from a hard copy computer printout containing raw data as well as processed quantities. This printout was scanned and digitized into a PDF file. This PDF file was put through Optical Character Recognition (OCR) software and saved as another PDF file. The resultant PDF file is human readable and all values are correct when viewed in an Adobe PDF reader. However, if you copy the contents and paste them into another application there may be errors in the values as the OCR process did not accurately compute all characters correctly. If you copy the data values into another application for analysis, double check the values against what is in the PDF file. The data are available via FTP. -
ExWaCli, ExWaMar (Norwegian Research Council grant 226239, Norwegian Research Council grant 256466)
Institutions: Norwegian Meteorological Institute, Norwegian Meteorological Institute, Norwegian Meteorological Institute / Arctic Data CentreShow more...
Abstract:
Wind field ensembles from six CMIP5 models force wave model time slices of the northeast Atlantic over the last three decades of the 20th and the 21st centuries. The future wave climate is investigated by considering the RCP4.5 and RCP8.5 emission scenarios.The CMIP5 model selection is based on their ability to reconstruct the present (1971–2000) extratropical cyclone activity, but increased spatial resolution has also been emphasized.License :
-
NMDC (NMDC)
Show more...
Abstract:
Dataset contains bottle and CTD observations from northern hemisphere for 1910-2015. In the current version ‘v04’ 45,125 stations were catalogued and divided on 729 parts/cruises available in NetCDF format. Detailed information about unloaded files can be found in Excel catalog (GFI_Hydrography_NC_catalog_v04.xlsx) located in the same folder.Access: Open -
Show more...
Abstract:
This dataset includes Geophysical Institute (GFI), University of Bergen mooring ANT196802_B data. The mooring consists of 1 inst. (instrument type:instrument number(instrument depth)):RCM4:70(640m) . Metadata and raw/processed time series are presented as NetCDF, text and pdf(plots with statistics, calibration sheets, mooring drawing) files.Access: Open -
NMDC (NMDC)
Show more...
Abstract:
Dataset contains time-series of current speed, direction, water temperature, salinity, oxygen and turbidity from 712 moorings instruments at different depths in the Nordic Seas, Northern North Atlantic, Gibraltar and Southern Ocean. Observations for each instrument unloaded into NetCDF (nc_v03_712_instrument_withTScorrection.zip), two text formats (txt_full_v03_712_instruments_withTScorrection.zip, txt_short_v03_712_instruments_withTScorrection.zip). Metadata and time-series are graphically represented in pdf files (http://folk.uib.no/ako091/NMDC/Currents/pdf/).Access: Open -
Show more...
Abstract:
This dataset includes Geophysical Institute (GFI), University of Bergen mooring ANT196802_A data. The mooring consists of 1 inst. (instrument type:instrument number(instrument depth)):RCM4:67(634m) . Metadata and raw/processed time series are presented as NetCDF, text and pdf(plots with statistics, calibration sheets, mooring drawing) files.Access: Open -
Institutions: Norwegian Meteorological Institute, Norwegian Meteorological Institute / Arctic Data Centre
Show more...
Abstract:
The product is based on a manual interpolation of available satellite data and insitu observations and provides a gridded map. It is a continuation of the previous sea ice chart which basically identified the ice edge.License :
Access: Open -
Not provided
Show more...
Abstract:
The maximum observed fast-ice thickness per season at Hopen (part of the Svalbard) during the period 1965/66 - 2007/08. The data file has two columns: a) the year the data connects to, and b) the thickness numbers in meters. If an observation is missing, data is set to 999.
Most ice thickness data were collected from drill holes in shore-fast sea ice within 150 m of shore. The accuracy for an ice thickness reading is 0.01 m (reading interval). Drill sites are not at the identical spot for each measurement throughout a season, resulting in apparent thickness changes due to local variability in ice thickness.
See also Søreide, O., 1994. Hopen. Ishavsøy og meteorologisk stasjon, 158 pp., Friske Tankar A. S., Øystese, Norway.
Quality
Since 1946, a Norwegian permanently manned meteorological station has been in operation on Hopen’s east coast (76° 30´N, 25° 01´E) where standard meteorological data are collected (Søreide, 1994). Regular ice thickness measurements were initiated in the 1960s by Torgny Vinje, Norwegian Polar Institute, resulting in 40 years of ice thickness measurements since winter 1965/1966 (Gerland et al., 2008). The fieldwork is conducted by the Hopen wintering teams of the Meteorological Institute of Norway (met.no), on request by and in collaboration with the Norwegian Polar Institute. The fast ice monitoring was recently updated and follows now a procedure similar to the Norwegian Polar Institute’s fast ice monitoring at Kongsfjorden at the western coast of Spitsbergen, Svalbard (Gerland and Renner, 2007). -
Nansen Legacy (Nansen Legacy)
Show more...
Abstract:
File “Fig_11_catch_harvestrate_and_stock.xls” give annual catches, stock abundance and harvest rates for the main commercial Barents Sea fish stocks (including shrimp which is the main shellfish stock). The harvest rates are derived from catches and stock abundance. Catches are given from 1965 onwards for all stocks, while the time series of stock abundance and thus harvest rates start later than 1965 for several stocks.Access: Open -
Show more...
Abstract:
The Barents Sea is one of the main pathways of Atlantic Water flowing towards the Arctic Ocean and a part of the Atlantic Meridional Overturning Circulation. Thus, changes in its water masses potentially affect the global thermohaline circulation through the alteration of the dense water formation process. This seasonal atlas of the Barents Sea includes a compilation of available observations of temperature and salinity from the period 1965–2016. The data are provided at a regular grid and at seasonal temporal resolution, using the Data Interpolating Variational Analysis (DIVA) tool, which allows for a minimization of the expected error with respect to the true field. The atlas is made freely accessible as user-friendly NetCDF files to encourage further research in the BS physics.Access: Open -
Show more...
Abstract:
This data set consists of upward looking sonar sea ice draft data collected by submarines in the Arctic Ocean.
It includes data from both U.S. Navy and Royal Navy submarines. Data are provided as ice draft profiles and as statistics derived from the profile data. Statistics files include information concerning ice draft characteristics, keels, level ice, leads, un-deformed and deformed ice. -
Spatiotemporal variability in mortality and growth of fish larvae and zooplankton in the Lofoten-Barents Sea ecosystem, The Nansen Legacy (SVIM, NLEG)
Institutions: Institute of Marine Reseach - Norway, Norwegian Meteorological Institute, Norwegian Meteorological Institute, Norwegian Meteorological InstituteShow more...
Abstract:
The SVIM archive contains results from an ocean and sea ice hindcast. The original version of the archive covered the period 1960-2011, and has later been extended on several occasions. The results are provided on a 4km polar stereographic grid projection, and the ocean model has a vertical resolution of 32 s layers. The focus is an adequate representation of the Atlantic influenced water masses within the Nordic Seas and the Barents Sea. Less emphasize has been put on the areas downstream of the Arctic bound Atlantic Water flow, i.e. the Arctic Ocean and the Greenland Sea. There were multiple aims for this product, including (1) process studies within physical oceanography, (2) representation of oceanographic conditions for other applications such as primary production models and individual-based models for zoo- and ichtyoplankton, (3) boundary values for smaller scale model studies. For ocean circulation the Regional Ocean Modeling System (ROMS; https://www.myroms.org/) was used (v.3.2 up to and including September 2018, v.3.5 thereafter). The sea-ice model used is similar to the module described in Budgell (Ocean Dyn. 2005). Boundary values for the ocean model were derived from the Simple Ocean Data Assimilation dataset (SODA v.2.1.6), while boundary values for the sea ice conditions were taken from a regional simulation (Sandø et al., JGR 2012). After 2008, the ocean boundaries were forced with monthly climatologies from 2000-2008, while for ice conditions after 2007, the 2000-2007 monthly climatologies were used. Tidal forcing was based on the global ocean tides model TPXO4. The quality of the model results for the original archive period were assessed by Lien et al. (2013; https://www.hi.no/resources/publikasjoner/fisken-og-havet/2013/fh_7-2013_swim_til_web.pdf).License :
-
Spatiotemporal variability in mortality and growth of fish larvae and zooplankton in the Lofoten-Barents Sea ecosystem (SVIM) (Spatiotemporal variability in mortality and growth of fish larvae and zooplankton in the Lofoten-Barents Sea ecosystem (SVIM))
Show more...
Abstract:
The dataset contains a amonthly climatology generated from a 54 year
(1958-2011) numerical ocean model hindcast archive, produced with the Regional
Ocean Modeling System (ROMS). ROMS is a three dimensional baroclinic ocean
general circulation model which uses topography-following s-coordinates in the
vertical. This ensures high vertical resolution in shallow areas such as shelf
seas and coastal areas. Here, the model is run on a grid with 32 s-layers in
the vertical. In the horizontal, the grid resolution is 4 km and covers the
Nordic, Barents and Kara seas, as well as parts of the Arctic Ocean. For
further reading check
http://www.imr.no/filarkiv/2014/01/fh_7-2013_swim_til_web.pdf
All SVIM data (daily, monthly, yearly, climatology) are currently
bundled in the same location, data will be separated when a better
application server is implemented.