- Citation of data and service
-
Always remember to cite data when used!
Citation information for individual datasets is often provided in the metadata. However, not all datasets have this information embedded in the discovery metadata. On a general basis a citation of a dataset include the same components as any other citation:
- author,
- title,
- year of publication,
- publisher (for data this is often the archive where it is housed),
- edition or version,
- access information (a URL or persistent identifier, e.g. DOI if provided)
The information required to properly cite a dataset is normally provided in the discovery metadata the datasets.
If you use data retrieved through this portal, please acknowledge the SAON Data Portal.
- Brief user guide
-
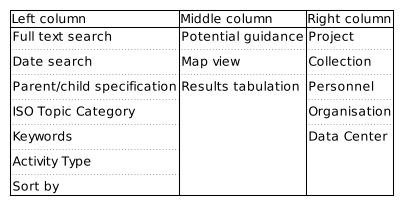
Outline of the data portal search interface. The Data Access Portal has information in 3 columns. An outline of the content in these columns is provided above. When first entering the search interface, all potential datasets are listed. Datasets are indicated in the map and results tabulation elements which are located in the middle column. The order of results can be modified using the "Sort by" option in the left column. On top of this column is normally relevant guidance information to user presented as collapsible elements.
If the user want to refine the search, this can be done by constraining the bounding box search. This is done in the map - the listing of datasets is automatically updated. Date constraints can be added in the left column. For these to take effect, the user has to push the button marked search. In the left column it is also possible to specific text elements to search for in the datasets. Again pushing the button marked "Search" is necessary for these to take action. Complex search patterns can be constructed using logical operators through the drop down menu above the text field. Text strings that are not quoted are treated as separate words and will match any of the words (i.e. assuming the OR operator). Phrases may be prefixed with '-' to indicate no occurence of the phrase in the results.
Other elements indicated in the left and right columns are facet searches, i.e. these are keywords that are found in the datasets and all datasets that contain these specific keywords in the appropriate metadata elements are listed together. Further refinement can be done using full text, date or bounding box constraints. Individuals, organisations and data centres involved in generating or curating the datasets are listed in the facets in the right column.
Visualize timeseries
Ice, Cloud and Land Elevation Satellite (ICESAT)
Show more...
Abstract:
NOTE ON GLAS BINARY DATA: Access to all ICESat/GLAS binary data products at NSIDC DAAC was removed 01 August 2017. The Binary Data Subsetter also has been decommissioned. ICESat/GLAS data remain available in <a href="http://nsidc.org/data/glah14/versions/34">HDF5 format</a>.
The Geoscience Laser Altimeter System (GLAS) instrument on the Ice, Cloud, and Land Elevation Satellite (ICESat) provides global measurements of polar ice sheet elevation to discern changes in ice volume (mass balance) over time. Secondary objectives of GLAS are to measure sea ice roughness and thickness, cloud and atmospheric properties, land topography, vegetation canopy heights, ocean surface topography, and surface reflectivity.
GLAS has a 1064 nm laser channel for surface altimetry and dense cloud heights, and a 532 nm lidar channel for the vertical distribution of clouds and aerosols.
This level-2 altimetry product (GLA14) provides surface elevations for land. Data also include the laser footprint gelocation and reflectance, as well as geodetic, instrument, and atmospheric corrections for range measurements.
Each data granule has an associated browse product that users can quickly view to determine the general quality of the data in the granule. Browse products consist of image plots of key parameters and statistics. Data are in scaled integer binary format, big-endian (Unix) byte order.-
Show more...
Abstract:
This data set reports the location of snow cover using radiance data acquired by the Visible Infrared Imager Radiometer Suite (VIIRS) on board the Joint Polar Satellite System's first satellite (JPSS-1). Snow cover is identified using the Normalized Difference Snow Index (NDSI) and a series of quality control screens. -
Operation Ice Bridge, LASER VEGETATION IMAGING SENSOR, AfriSAR (OIB, LVIS, AfriSAR)
Show more...
Abstract:
This data set contains geotagged images collected over Gabon, Africa. The images were taken by the NASA Digital Mapping Camera paired with the Land, Vegetation, and Ice Sensor (LVIS), an airborne lidar scanning laser altimeter. The data were collected as part of a NASA campaign, in collaboration with the European Space Agency (ESA) mission AfriSAR. -
Show more...
Abstract:
This global Level-3 (L3) data set provides daily daytime sea ice extent and ice surface temperature derived from the 'MODIS/Terra Sea Ice Extent 5-Min L2 Swath 1km' (https://doi.org/10.5067/MODIS/MOD29.061) product. Each data granule is a tile consisting of 10 x 10 degrees of data gridded to the Lambert Azimuthal Equal Area Scalable Earth Grid (EASE-Grid).
The terms "Version 61" and "Collection 6.1" are used interchangeably in reference to this release of MODIS data. -
SnowEx (SnowEx)
Show more...
Abstract:
This data contains snow depth measurements derived from time-lapse images collected by cameras placed around Grand Mesa, CO at 29 sites coincident with other SnowEx 2020 measurements. The field view of all cameras includes a 3.049 m, (10 ft) vertical pole that was painted red with a yellow top to serve as a reference for quantifying snow depth. The time-lapse images are archived separately at NSIDC (SNEX20_TLI). -
Soil Moisture Active Passive (SMAP)
Show more...
Abstract:
<p>Each Level-1A (L1A) granule incorporates all radiometer data downlinked from the Soil Moisture Active Passive (SMAP) spacecraft for one specific half orbit. The data are scaled instrument counts of the following:</p>
<ul>
<li>The first four raw moments of the fullband channel for both vertical and horizontal polarizations</li>
<li>The complex cross-correlations of the fullband channel</li>
<li>The 16 subband channels for both vertical and horizontal polarizations</li>
</ul> -
Operation Ice Bridge, LASER VEGETATION IMAGING SENSOR, Arctic-Boreal Vulnerability Experiment (OIB, LVIS, ABoVE)
Show more...
Abstract:
This data set contains Level-2 geolocated surface elevation and canopy height measurements collected by the NASA Land, Vegetation, and Ice Sensor (LVIS) Facility, an imaging lidar and camera sensor suite. -
Soil Moisture Active Passive, Soil Moisture Active Passive Validation Experiment 2016 Manitoba (SMAP, SMAPVEX16 Manitoba)
Show more...
Abstract:
This data set contains in situ Leaf Area Index (LAI) data collected for the Soil Moisture Active Passive Validation Experiment 2016 Manitoba (SMAPVEX16 Manitoba) campaign. -
Arctic-Boreal Vulnerability Experiment, LASER VEGETATION IMAGING SENSOR, Operation Ice Bridge (ABoVE, LVIS, OIB)
Show more...
Abstract:
This data set contains surface elevation data over Alaska and Western Canada measured by the NASA Land, Vegetation, and Ice Sensor (LVIS), an airborne lidar scanning laser altimeter. The data were collected as part of NASA's Terrestrial Ecology Program campaign, the Arctic-Boreal Vulnerability Experiment (ABoVE). -
Soil Moisture Active Passive, Soil Moisture Active Passive Validation Experiment 2016 Manitoba (SMAP, SMAPVEX16 Manitoba)
Show more...
Abstract:
This data set contains brightness temperatures obtained by in situ L-band radiometers. The data were collected for the Soil Moisture Active Passive Validation Experiment 2016 Manitoba (SMAPVEX16 Manitoba) campaign. -
Operation Ice Bridge (OIB)
Show more...
Abstract:
This data set contains static pressure values for Antarctica using the Paroscientific Digiquartz Transmitter. The data were collected by scientists working on the Investigating the Cryospheric Evolution of the Central Antarctic Plate (ICECAP) project, which is funded by the National Science Foundation (NSF) and the Natural Environment Research Council (NERC) with additional support from NASA Operation IceBridge. -
High Mountain Asia (HMA)
Show more...
Abstract:
This data set contains snow bidirectional reflectance factor (BRF) between 350 and 2500 nm collected on the Yala Glacier on 23 April and 24 April 2018 by the International Centre for Integrated Mountain Development (ICIMOD). -
Soil Moisture Active Passive Validation Experiment 2016 Manitoba, Soil Moisture Active Passive (SMAPVEX16 Manitoba, SMAP)
Show more...
Abstract:
This data set contains in situ measurements of soil moisture and bulk density collected for the Soil Moisture Active Passive Validation Experiment 2016 Manitoba (SMAPVEX16 Manitoba) campaign. -
Earth Science Information Partners Program, Earth Observing System Data Information System (ESIP, EOSDIS)
Show more...
Abstract:
This archive of daily rawinsonde measurements of wind direction and speed, atmospheric pressure, humidity, air temperature, and geopotential height as well as surface-based observation of cloud cover (amount, type and height) from Soviet North Pole drifting stations was assembled under the direction of Dr. J. Kahl, with funding from the National Oceanic and Atmospheric Administration, the National Science Foundation, and the Electric Power Research Institute. Soundings were recorded from April 19, 1954 to July 31, 1990 at drifting stations located in the Arctic Ocean, north of approximately 70 degrees North. Data were obtained from several different sources. All of these data are ultimately derived from the set of bound volumes of handwritten tables kept at the Arctic and Antarctic Research Institute (AARI) in St. Petersburg, Russia. Data are in 21 ASCII text format files with an average size of under 10 MB. -
Making Earth System Data Records for Use in Research Environments (MEaSUREs)
Show more...
Abstract:
This data set, part of the NASA Making Earth System Data Records for Use in Research Environments (MEaSUREs) program, contains annual ice velocity mosaics for the Greenland Ice Sheet. Velocities are derived from synthetic aperture radar (SAR) data, obtained by TerraSAR-X/TanDEM-X and Sentinel-1A and -1B, and from optical imagery acquired by Landsat 8 and Landsat 9. See <a href="http://nsidc.org/data/measures/gimp">Greenland Ice Mapping Project (GrIMP)</a> for related data.