- Citation of data and service
-
Always remember to cite data when used!
Citation information for individual datasets is often provided in the metadata. However, not all datasets have this information embedded in the discovery metadata. On a general basis a citation of a dataset include the same components as any other citation:
- author,
- title,
- year of publication,
- publisher (for data this is often the archive where it is housed),
- edition or version,
- access information (a URL or persistent identifier, e.g. DOI if provided)
The information required to properly cite a dataset is normally provided in the discovery metadata the datasets.
If you use data retrieved through this portal, please acknowledge the SAON Data Portal.
- Brief user guide
-
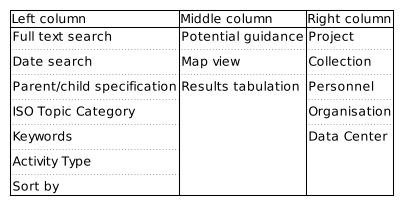
Outline of the data portal search interface. The Data Access Portal has information in 3 columns. An outline of the content in these columns is provided above. When first entering the search interface, all potential datasets are listed. Datasets are indicated in the map and results tabulation elements which are located in the middle column. The order of results can be modified using the "Sort by" option in the left column. On top of this column is normally relevant guidance information to user presented as collapsible elements.
If the user want to refine the search, this can be done by constraining the bounding box search. This is done in the map - the listing of datasets is automatically updated. Date constraints can be added in the left column. For these to take effect, the user has to push the button marked search. In the left column it is also possible to specific text elements to search for in the datasets. Again pushing the button marked "Search" is necessary for these to take action. Complex search patterns can be constructed using logical operators through the drop down menu above the text field. Text strings that are not quoted are treated as separate words and will match any of the words (i.e. assuming the OR operator). Phrases may be prefixed with '-' to indicate no occurence of the phrase in the results.
Other elements indicated in the left and right columns are facet searches, i.e. these are keywords that are found in the datasets and all datasets that contain these specific keywords in the appropriate metadata elements are listed together. Further refinement can be done using full text, date or bounding box constraints. Individuals, organisations and data centres involved in generating or curating the datasets are listed in the facets in the right column.
Visualize timeseries
Show more...
Abstract:
Database for deep sea benthic ecological dataAccess: academic-
Show more...
Abstract:
The Norwegian Polar Institute measures mass balance on three glaciers, all in the Kongsfjorden area of north-western Spitsbergen, Svalbard. They are: Austre Brøggerbreen (data since 1967, Midtre Lovénbreen (since 1968) and Kongsvegen (since 1987). The first two are among the longest continuous high arctic glacier mass balance time-series. The Norwegian Polar Institute uses the so-called “combined method”, a mixture of the fixed-date and the stratigraphic methods, and comprises sounding of winter snow depth and repeated measurement of heights of an array of 8-10 stakes along the glacier centerline. Winter balance is obtained by snow-depth soundings over much of the glacier, an estimate of the autumn superimposed ice by shallow ice-cores along the longitudinal axis or at least by a measurement at the bottom of snow pits, stake height measurements, and snow density measurements. The work is carried out at the end of the accumulation period, in May. Stake positions are measured using differential GPS every year to monitor long-term velocity and elevation changes, both of which respond to the yearly mass fluctuations. Summer balance is obtained directly by comparing stake heights made in spring to fall stake measurements. The latter work is usually done at the end of the ablation period (in September and sometimes in October). Balance estimates are extrapolated over the entire glacier basin by using the distribution of glacier area per 50-m elevation band (hypsometry) obtained from maps or digital elevation models (DEMs). Net, winter and summer mass balance values are reported each year to MOSJ and as well to the World Glacier Monitoring Service. -
SEAPOP (SEAPOP)
Show more...
Abstract:
SEAPOP (SEAbird POPulations) is a long-term monitoring and mapping programme for Norwegian seabirds that was established in 2005. The programme represents a new initiative for these activities in Norway, Svalbard and adjacent sea areas, and will provide and maintain base-line knowledge of seabirds for an improved management of this marine environment. The data analyses aim to develop further models of seabird distribution and population dynamics using different environmental parameters, and to explore the degree of covariation across different sites and species. This knowledge is urgently needed to distinguish human influences from those caused by natural variation. -
Not provided
Show more...
Abstract:
The maximum observed fast-ice thickness per season at Hopen (part of the Svalbard) during the period 1965/66 - 2007/08. The data file has two columns: a) the year the data connects to, and b) the thickness numbers in meters. If an observation is missing, data is set to 999.
Most ice thickness data were collected from drill holes in shore-fast sea ice within 150 m of shore. The accuracy for an ice thickness reading is 0.01 m (reading interval). Drill sites are not at the identical spot for each measurement throughout a season, resulting in apparent thickness changes due to local variability in ice thickness.
See also Søreide, O., 1994. Hopen. Ishavsøy og meteorologisk stasjon, 158 pp., Friske Tankar A. S., Øystese, Norway.
Quality
Since 1946, a Norwegian permanently manned meteorological station has been in operation on Hopen’s east coast (76° 30´N, 25° 01´E) where standard meteorological data are collected (Søreide, 1994). Regular ice thickness measurements were initiated in the 1960s by Torgny Vinje, Norwegian Polar Institute, resulting in 40 years of ice thickness measurements since winter 1965/1966 (Gerland et al., 2008). The fieldwork is conducted by the Hopen wintering teams of the Meteorological Institute of Norway (met.no), on request by and in collaboration with the Norwegian Polar Institute. The fast ice monitoring was recently updated and follows now a procedure similar to the Norwegian Polar Institute’s fast ice monitoring at Kongsfjorden at the western coast of Spitsbergen, Svalbard (Gerland and Renner, 2007). -
Nansen Legacy (Nansen Legacy)
Show more...
Abstract:
File “Fig_11_catch_harvestrate_and_stock.xls” give annual catches, stock abundance and harvest rates for the main commercial Barents Sea fish stocks (including shrimp which is the main shellfish stock). The harvest rates are derived from catches and stock abundance. Catches are given from 1965 onwards for all stocks, while the time series of stock abundance and thus harvest rates start later than 1965 for several stocks.Access: Open -
Show more...
Abstract:
The Barents Sea is one of the main pathways of Atlantic Water flowing towards the Arctic Ocean and a part of the Atlantic Meridional Overturning Circulation. Thus, changes in its water masses potentially affect the global thermohaline circulation through the alteration of the dense water formation process. This seasonal atlas of the Barents Sea includes a compilation of available observations of temperature and salinity from the period 1965–2016. The data are provided at a regular grid and at seasonal temporal resolution, using the Data Interpolating Variational Analysis (DIVA) tool, which allows for a minimization of the expected error with respect to the true field. The atlas is made freely accessible as user-friendly NetCDF files to encourage further research in the BS physics.Access: Open -
Show more...
Abstract:
The dataset consists of several thousands of datapoints, obtained during hydrographc surveys in fjords and coastal areas of Norway from Barents Sea in north to Oslofjord in south. Source: Norwegian Mapping Authority, Hydrographic ServiceAccess: distribution cost charge -
Spatiotemporal variability in mortality and growth of fish larvae and zooplankton in the Lofoten-Barents Sea ecosystem, The Nansen Legacy (SVIM, NLEG)
Institutions: Institute of Marine Reseach - Norway, Norwegian Meteorological Institute, Norwegian Meteorological Institute, Norwegian Meteorological InstituteShow more...
Abstract:
The SVIM archive contains results from an ocean and sea ice hindcast. The original version of the archive covered the period 1960-2011, and has later been extended on several occasions. The results are provided on a 4km polar stereographic grid projection, and the ocean model has a vertical resolution of 32 s layers. The focus is an adequate representation of the Atlantic influenced water masses within the Nordic Seas and the Barents Sea. Less emphasize has been put on the areas downstream of the Arctic bound Atlantic Water flow, i.e. the Arctic Ocean and the Greenland Sea. There were multiple aims for this product, including (1) process studies within physical oceanography, (2) representation of oceanographic conditions for other applications such as primary production models and individual-based models for zoo- and ichtyoplankton, (3) boundary values for smaller scale model studies. For ocean circulation the Regional Ocean Modeling System (ROMS; https://www.myroms.org/) was used (v.3.2 up to and including September 2018, v.3.5 thereafter). The sea-ice model used is similar to the module described in Budgell (Ocean Dyn. 2005). Boundary values for the ocean model were derived from the Simple Ocean Data Assimilation dataset (SODA v.2.1.6), while boundary values for the sea ice conditions were taken from a regional simulation (Sandø et al., JGR 2012). After 2008, the ocean boundaries were forced with monthly climatologies from 2000-2008, while for ice conditions after 2007, the 2000-2007 monthly climatologies were used. Tidal forcing was based on the global ocean tides model TPXO4. The quality of the model results for the original archive period were assessed by Lien et al. (2013; https://www.hi.no/resources/publikasjoner/fisken-og-havet/2013/fh_7-2013_swim_til_web.pdf).License :
-
Spatiotemporal variability in mortality and growth of fish larvae and zooplankton in the Lofoten-Barents Sea ecosystem (SVIM) (Spatiotemporal variability in mortality and growth of fish larvae and zooplankton in the Lofoten-Barents Sea ecosystem (SVIM))
Show more...
Abstract:
The dataset contains a amonthly climatology generated from a 54 year
(1958-2011) numerical ocean model hindcast archive, produced with the Regional
Ocean Modeling System (ROMS). ROMS is a three dimensional baroclinic ocean
general circulation model which uses topography-following s-coordinates in the
vertical. This ensures high vertical resolution in shallow areas such as shelf
seas and coastal areas. Here, the model is run on a grid with 32 s-layers in
the vertical. In the horizontal, the grid resolution is 4 km and covers the
Nordic, Barents and Kara seas, as well as parts of the Arctic Ocean. For
further reading check
http://www.imr.no/filarkiv/2014/01/fh_7-2013_swim_til_web.pdf
All SVIM data (daily, monthly, yearly, climatology) are currently
bundled in the same location, data will be separated when a better
application server is implemented. -
Show more...
Abstract:
Fauna database for Svalbard, some from Jan Mayen and a little from open sea.
Text below is extracted from [Norsk Polarinstitutt Årbok 1982: 55–57](http://www.nb.no/idtjeneste/URN:NBN:no-bibsys_brage_46890) (1983):
FRIDTJOF MEHLUM:
A DATABASE FOR OBSERVATIONS ON THE ANIMAL LIFE OF
SVALBARD
The observations of the animal life in Svalbard made by members of
different scientific expeditions and other visitors to the islands are often
reported in odd journals or expedition reports. As an institute responsible
for biological mapping and research conceming management of the biological
resources in the Svalbard area, Norsk Polarinstitutt gathers all available
observation data on the different animal species in this area.
A comprehensive faunistic paper on the birds of Svalbard was published
by Dr. Herman Løvenskiold in his thesis 'Avifauna Svalbardensis'
which appeared in 1964. His work, however, included only observations
made before 1960. In later years the activity of biologists and other skilled
observers has increased remarkedly, and much new faunistic information
is reported. The most interesting records reported to Norsk Polarinstitutt
have been published annually in the Institute's year books.
In the middle of the l 970s the amount of faunistic information had
increased so much that the Institute decided to establish a database to cope
with it all. The database is now operative in its first phase. It contains
both single observations and systematically sampled data from research
groups. So far, only birds and mammals are included in the base. Most of
the observations are from the period after 1960, but some are from earlier
literature (e.g. Løvenskiold 1964 ).
The main applications of the database are:
1. Mapping of distribution and abundance of different animal species.
2. Mapping of geographical areas with concentrations of animal life, such
as bird cliffs, hauling out and whelping grounds for seals. In other
words, areas where the animal life can be threatened by disturbances
or pollution.
3. Supply of information about the reproduction and different types
of biometrical data of the species concemed. "
The information stored in the database can be handled by easy computer
commands to provide the desired tables and maps. One application
could be to select all available observations of a species made during certain
specified months of the year, another to select all animal observations
recorded in a limited geographical area. A practical example of the latter
case would appear in connection with a presumptive future oil spill along
the coast of Spitsbergen. From the database one can easily select the coastal
areas with animal life of special conservation value, and put all efforts into
these areas to protect the animals from damage or to minimize the damage.
At the end of 1982 the database comprised about 4700 observations
from the land areas of Svalbard. In addition a comprehensive material on
the pelagic distribution of sea birds and marine mammals in the seas and ice
covered areas around Svalbard will be included in the base in the near
future. This information was collected by Norsk Polarinstiutt in the years
1980-82. An example of distribution maps based on these observations
is presented as Fig. 1. Here the distribution of the Briinnich's guillemot
Uria lomiva during the two expedition cruises by M/S 'Lance' in July -
August 1982, is shown.
The database is currently being expanded and will be annually updated
to comprise all available records of different species of birds and
mammals. The base will be available to researchers, institutions, and other
users. For foreign users, the outputs can be supplied in English. -
Show more...
Abstract:
Marine fish species (Artsobservasjoner.no) -
Spatiotemporal variability in mortality and growth of fish larvae and zooplankton in the Lofoten-Barents Sea ecosystem (SVIM) (Spatiotemporal variability in mortality and growth of fish larvae and zooplankton in the Lofoten-Barents Sea ecosystem (SVIM))
Show more...
Abstract:
The dataset contains daily averages from a 54 year (1958-2011) numerical
ocean model hindcast archive, produced with the Regional Ocean
Modeling System (ROMS). ROMS is a three dimensional baroclinic
ocean general circulation model which uses topography-following
s-coordinates in the vertical. This ensures high vertical resolution
in shallow areas such as shelf seas and coastal areas. Here, the
model is run on a grid with 32 s-layers in the vertical. In the
horizontal, the grid resolution is 4 km and covers the Nordic,
Barents and Kara seas, as well as parts of the Arctic Ocean. For
further reading check http://www.imr.no/filarkiv/2014/01/fh_7-2013_swim_til_web.pdf
All SVIM data (daily, monthly, yearly, climatology) are currently
bundled in the same location, data will be separated when a better
application server is implemented.Access: CC BY/NLOD -
Spatiotemporal variability in mortality and growth of fish larvae and zooplankton in the Lofoten-Barents Sea ecosystem (SVIM) (Spatiotemporal variability in mortality and growth of fish larvae and zooplankton in the Lofoten-Barents Sea ecosystem (SVIM))
Show more...
Abstract:
The dataset contains monthly averages from a 54 year (1958-2011) numerical
ocean model hindcast archive, produced with the Regional Ocean
Modeling System (ROMS). ROMS is a three dimensional baroclinic
ocean general circulation model which uses topography-following
s-coordinates in the vertical. This ensures high vertical resolution
in shallow areas such as shelf seas and coastal areas. Here, the
model is run on a grid with 32 s-layers in the vertical. In the
horizontal, the grid resolution is 4 km and covers the Nordic,
Barents and Kara seas, as well as parts of the Arctic Ocean. For
further reading check http://www.imr.no/filarkiv/2014/01/fh_7-2013_swim_til_web.pdf
All SVIM data (daily, monthly, yearly, climatology) are currently
bundled in the same location, data will be separated when a better
application server is implemented.Access: CC BY/NLOD -
Spatiotemporal variability in mortality and growth of fish larvae and zooplankton in the Lofoten-Barents Sea ecosystem (SVIM) (Spatiotemporal variability in mortality and growth of fish larvae and zooplankton in the Lofoten-Barents Sea ecosystem (SVIM))
Show more...
Abstract:
The dataset contains yearly averages from a 54 year (1958-2011) numerical
ocean model hindcast archive, produced with the Regional Ocean
Modeling System (ROMS). ROMS is a three dimensional baroclinic
ocean general circulation model which uses topography-following
s-coordinates in the vertical. This ensures high vertical resolution
in shallow areas such as shelf seas and coastal areas. Here, the
model is run on a grid with 32 s-layers in the vertical. In the
horizontal, the grid resolution is 4 km and covers the Nordic,
Barents and Kara seas, as well as parts of the Arctic Ocean. For
further reading check http://www.imr.no/filarkiv/2014/01/fh_7-2013_swim_til_web.pdf
All SVIM data (daily, monthly, yearly, climatology) are currently
bundled in the same location, data will be separated when a better
application server is implemented.